
Where does Bitcoin go from here?

Bitcoin has plunged more than $40k in just six weeks—despite no obvious fundamental catalyst beyond the unfortunate reality that market structure has flipped sharply negative (ETF outflows, the Coinbase discount, structural selling, poorly positioned longs getting liquidated, etc.). Ongoing concerns regarding whales selling, lack of defensive liquidity provisioning by loss-ridden market makers, existential threats of quantum, relative value of AI beta etc. all remain overhangs to a potentially swift recovery. And yet through this entire drawdown, one question keeps nagging at me: what exactly has been going on with Bitcoin volatility?
Bitcoin’s volatility regime has quietly shifted beneath the surface. For the last two years, the narrative has been simple: the ETF era has tamed Bitcoin, crushed volatility, and turned what was once a wild macro-sensitive asset into something that trades bounded by institutional guardrails of volatility muting behaviors. But zoom in on the last 60 days, and the picture changes a little bit. Something in the structure of Bitcoin’s volatility markets is stirring again—something that looks more like the old Bitcoin, not the new one.
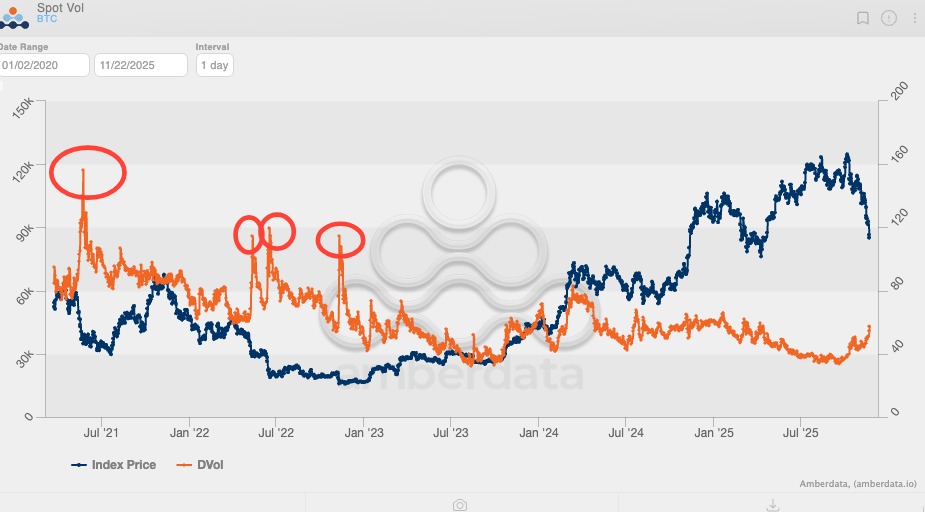
When you look at Bitcoin’s implied volatility over the last five years, a handful of global and local peaks stand out. The first—and highest—came in May 2021 when China banned Bitcoin mining, sending IV to 156%. The second, in May 2022, was the Luna/UST collapse, peaking at 114%. The third spike followed the 3AC liquidation wave in June–July 2022. The fourth was the FTX implosion in November 2022.
Since then, volatility has never traded above 80%. The closest it came was in March 2024, when the spot Bitcoin ETFs saw three months of relentless inflows.
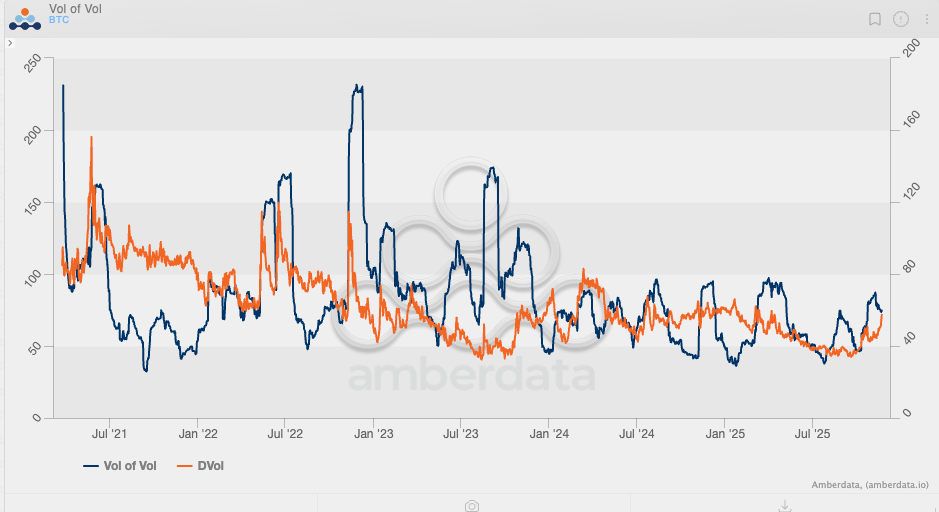
A cleaner pattern emerges when you examine the vol-of-vol index—essentially the second derivative of volatility, or the velocity of how fast volatility itself moves. Here, the highest reading came during the FTX collapse, when vol-of-vol surged to ~230.
Ever since the ETF launch in early 2024, vol-of-vol has never breached 100, and implied volatility has trended consistently lower regardless of spot direction. In other words, Bitcoin lost the convex, breakaway vol behavior that defined its pre-ETF market structure.
But something changed a little bit over the last 60 days. Bitcoin volatility has showed an upward sloping trend for the first time in 2025 over the last several weeks.
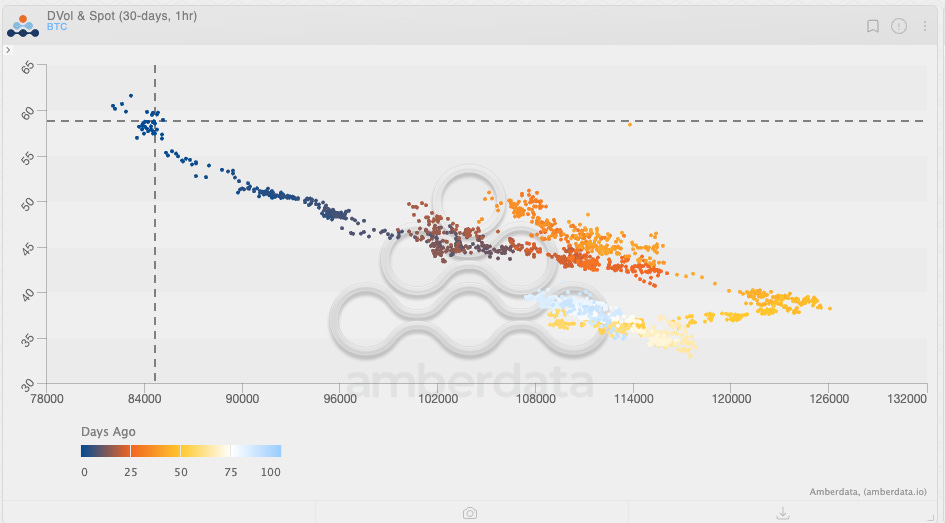
Look at the chart above and pay attention to the color gradient (light blue to dark blue marking “days ago”). As you trace the recent movement, you’ll notice a brief window where spot was climbing toward 125 and IV was rising simultaneously. It looked like Bitcoin volatility was finally regaining its footing—hinting at a potential breakout with a positive vol/spot correlation. Instead, we now know the move reversed lower.
What’s more interesting is that IV continued rising even as spot fell. Since the ETF era began, it has been rare to see a sustained regime where Bitcoin falls and IV rises. That dynamic was common pre-ETF, but anomalous post-ETF.
This might be the first signal of a regime shift: Bitcoin and implied volatility are behaving more like the pre-ETF era than the post-ETF era.
For a necessary context to understand this implication, the skew chart underscores what we might be able to expect. During crises, put skew typically blows out quickly—you can see it reaching –25% during each of the three major events above. But the most notable datapoint isn’t a crash at all. It’s January 2021, when call skew peaked above +50%.
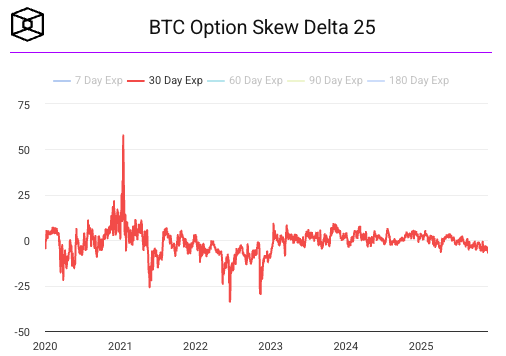
That was Bitcoin’s last true mega-gamma squeeze as we know it in recent memory. BTC ripped from $20k to $40k, blasting through its 2017 ATH and triggering a wave of trend-followers, CTAs, and momentum funds. Upside realized vol exploded; dealers were forced to buy spot/futures to hedge their short call gamma, which in turn pushed price even higher. It was also the first time Deribit saw record retail flows as traders discovered the power of OTM calls.
This is why understanding options positioning is so critical. Ultimately, it is options positioning—not just spot flows—that creates the decisive moves that carry Bitcoin to new highs.
It’s possible that for the first time in nearly two years, the volatility surface is flickering with early signs that Bitcoin might become option-driven again. If this regime shift continues, the next big leg higher in Bitcoin won’t come from ETF inflows only—it will come from a volatility market that finally remembers what Bitcoin is capable of.
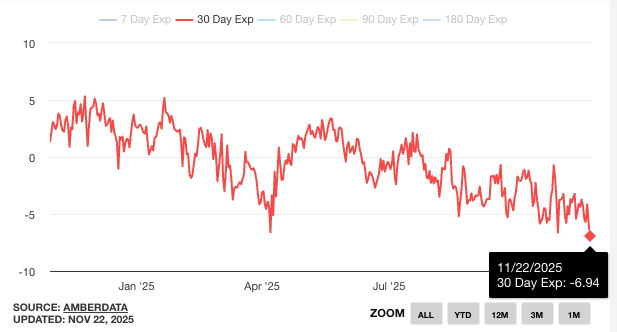
And while the above put skew chart may not show the local movement to be material, here is a zoomed in version of the chart — the 30 day put skew is the lowest that it has been all year. This implies that the premium for defensive positioning is at a local high, and therefore further volatility to the downside is not unwarranted.
Yet with that, these are the Top 5 open interest USD notional trades on Deribit as of today (November 22, 2025):
$1Bn in 12/26/25 85k Puts
$950mm in 12/26/25 140k Calls
$720mm in 12/26/25 200k Calls
$660mm in 11/28/25 80k Puts
$620mm in 12/26/25 125k Calls
In addition, the ten largest IBIT options positions as of today are below:
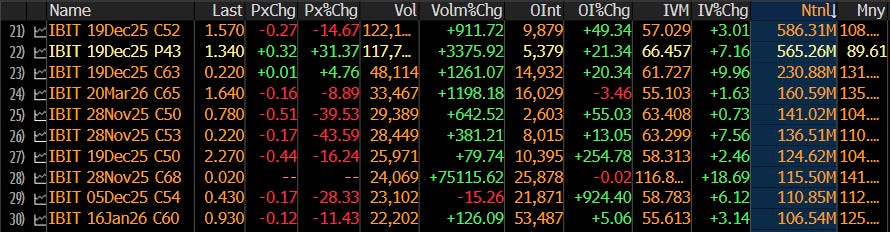
The takeaway here is that there are more calls for year-end positioning than puts in notional terms, and the range of strikes are more OTM than the puts.
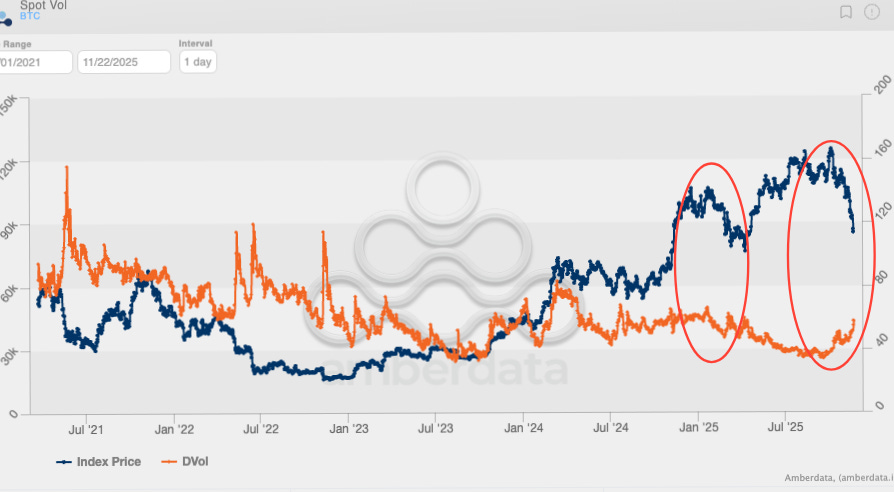
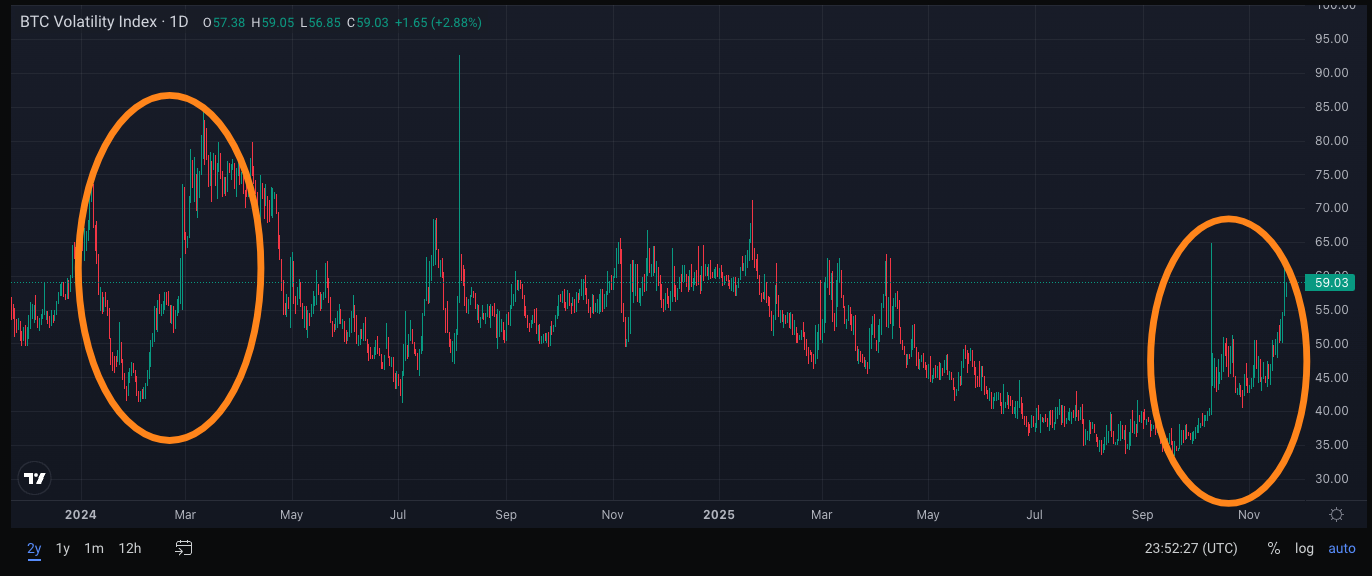
Lastly, look at the two-year IV chart below. The consistent bid for vol over the last 2 months is the closest thing that looks like the same part of the chart in February-March 2024 timeframe. Many will remember that this was the great melt-up of the Bitcoin ETF flows-driven upside. In other words, Wall Street needs high volatility for Bitcoin to be interesting. That is because Wall Street is a trend business, and this trend business likes to maximize P&L by end of year for bonus season. Volatility is a reflexive machine.
It is still too early to definitively see if vol has made a breakout trend and whether ETF flows will follow, and that means spot can continue to go lower. But if spot pushes lower from here and IV manages to climb during that move, it strengthens the case that a sharp upside reversal could also materialize—especially in a sticky-strike environment where traders are still leaning into topside optionality. But if the selloff continues while vol stalls or even slips—classic sticky-delta behavior, with upside positioning fading as a consequence—then the path out of the drawdown narrows considerably especially if the structured selling over the recent days create a cascade of negative externalities. In that scenario, the market feels less like it’s searching for a springboard and more like it’s settling into the early contours of a potential bear trend.
The next several weeks will be interesting to watch.
sir, can u put it simply for users that are not familiar with IV and options please
where for market maker to go first, max pain reality for MM’s is imho to neutralise short traders