
Bitcoin's End of the 4-year Cycle is the Beginning of a New "2-year Cycle"
Exploring an alternative framework to assess boom-bust cycles for the coming ages

Bitcoin used to follow a four-year cycle that can be described as a combination of 1) mining economics and 2) behavioral psychology.
Let us review what that cycle meant first: Each halving mechanically cut new supply and tightened miner margins which forced weaker players out of the market reducing sell pressure. This then reflexively would raise marginal cost of new BTC and then crate a slow but structural supply squeeze. As this played out, frenzied investors anchored to the predictable halving narrative, creating a psychological feedback loop. The loop was: early positioning, rising prices, attention virality via media, retail FOMO, and eventually leveraged mania that results in a bust. The cycle worked because it was the combination of a programmed supply shock and the reflexive herd behavior it seemingly reliably triggered.
But this is the old Bitcoin.
Because we know the supply part of the equation is less potent than ever.

So what are we to expect going forward?
I make the case that in the future, Bitcoin is going to follow a “two-year cycle” that can be described as a combination of 1) fund manager economics and 2) behavioral psychology that is dictated by ETF footprints. I am of course making three heavy-handed contestable assumptions that 1) investors are assessing their investment into bitcoin in a one-two year timeframes (and not longer than that, because that is how most asset management ICs work in the context of liquid fund management. These are not PE/VC close end structures that own Bitcoin in the end. It unforgivingly assumes FAs and RIAs operate in a similar framework too) and 2) professional investor flows via ETFs will dominate Bitcoin liquidity as far as “new liquidity inlay sources” are concerned and ETFs become the proxy to track, and 3) the OG whale selling behavior is unchanged/not taken into account as part of analysis which is now the largest supply setter in the market.
In asset management, there are important factors that determine flows. The first is 1) common holder risk, and 2) YTD P&L.
On common holder risk, this is the concern that “everyone owns the same thing” and therefore a potential move is exacerbated by everyone needing to do the same trade when liquidity is one-way. We see these phenomenons commonly with rotations (thematic concentration), short squeezes (GS VIP basket), pair trades (rel val), and merger arbs/event driven situations gone awry. But we also see this commonly multi-asset as well, in CTA models, risk parity strategies, and of course in fiscal dominance trades where equities represent asset inflation. These dynamic factors are hard to model, require significant proprietary information on positioning, and so is not easy for the common investor to access nor understand. (I will look to discuss this for another day.)
But what is easily observable is #2) YTD P&L.
This is the phenomenon in which the asset management industry operates on a calendar cycle, because fund fees are crystallized in an annual schedule by 12/31 performance. This is especially pronounced for hedge funds, that need to crystallize their carry before the end of the year. In other words, when volatility increases towards end of the year and the manager doesn’t have enough P&L “baked in” from earlier in the year to provide a buffer, they are more sensitive to selling their riskiest positions. This is the difference between getting another shot to play in 2026, or getting fired.
In Flows, Price Pressure, and Hedge Fund Returns, Ahoniemi & Jylhä (2011) document that capital inflows mechanically push returns higher, those higher returns attract additional inflows, and eventually the cycle reverses, with the full return-reversal process taking almost two years. They also estimate that roughly 1/3 of reported HF alpha is actually attributable to these flow-driven effects rather than manager skill. This creates a clear understanding for a potential cyclical dynamic in which returns are heavily shaped by investor behavior and liquidity pressure, not just by underlying strategy performance, that dictate the newest flows into the Bitcoin asset class.
So with that in mind, consider how a fund manager evaluates a position like Bitcoin. To their investment committee, they are likely making the case that the CAGR on BTC is something like 25%, and therefore need to compound over 50% in that timeframe.
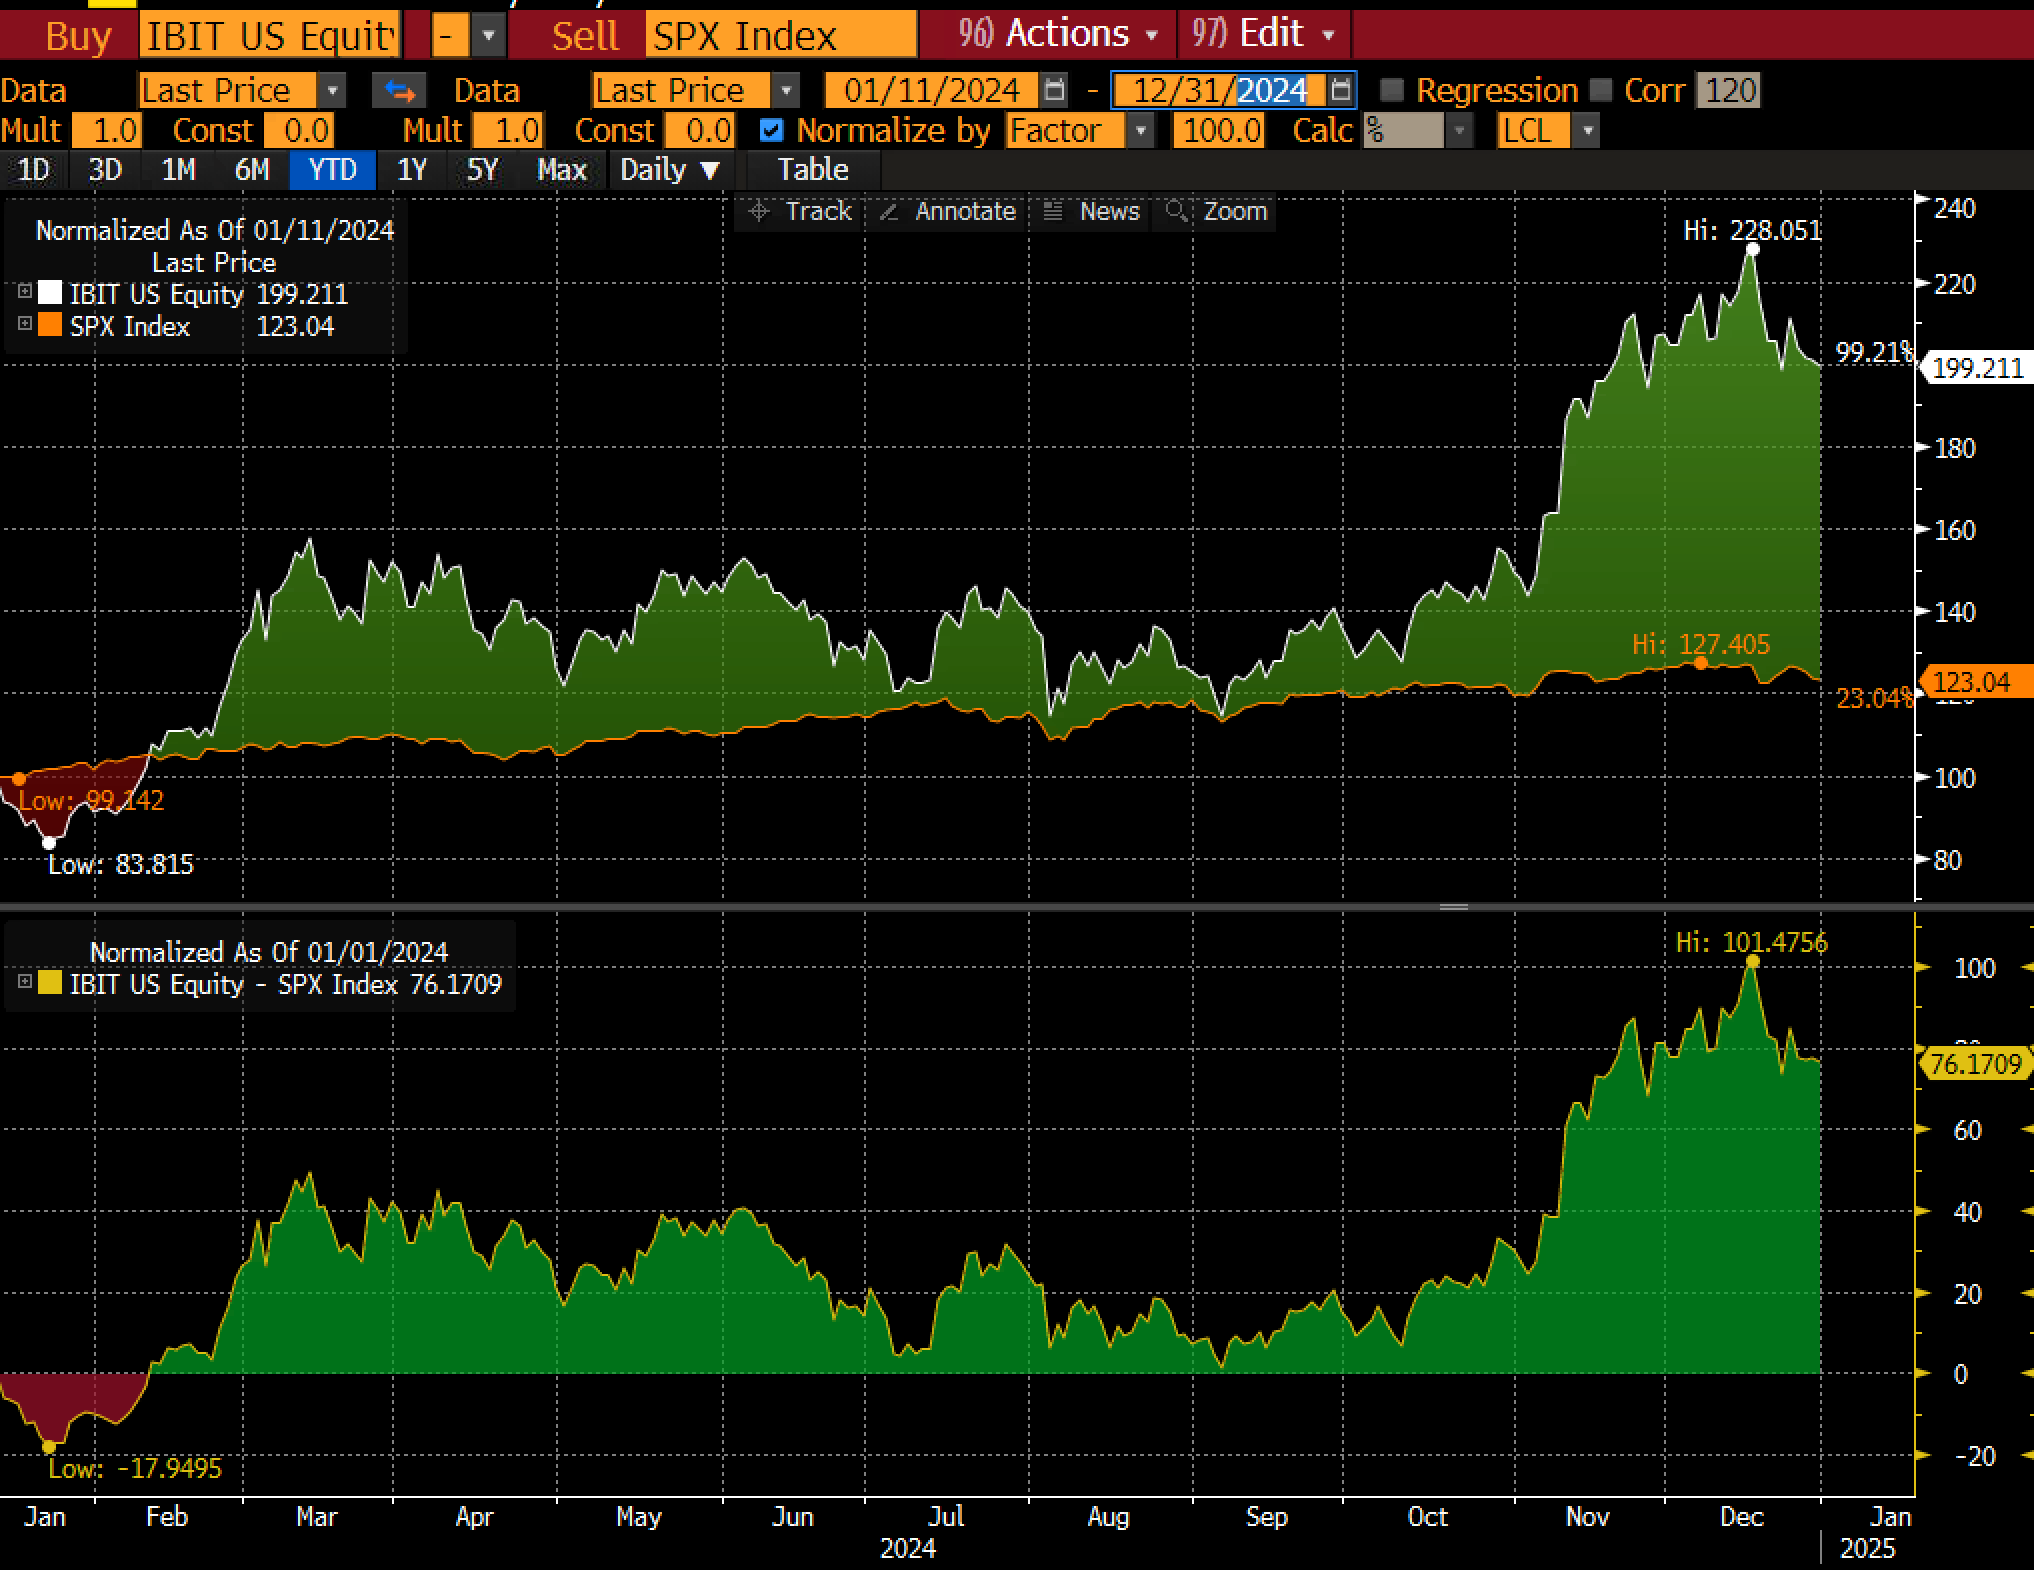
In scenario 1 (inception to year-end 2024), BTC is up 100% in 1 year, and so that is good. Assuming Saylor’s 30% CAGR for the next 20 years is the “institutional hurdle,” a year like this pulled forward 2.6 years of performance.
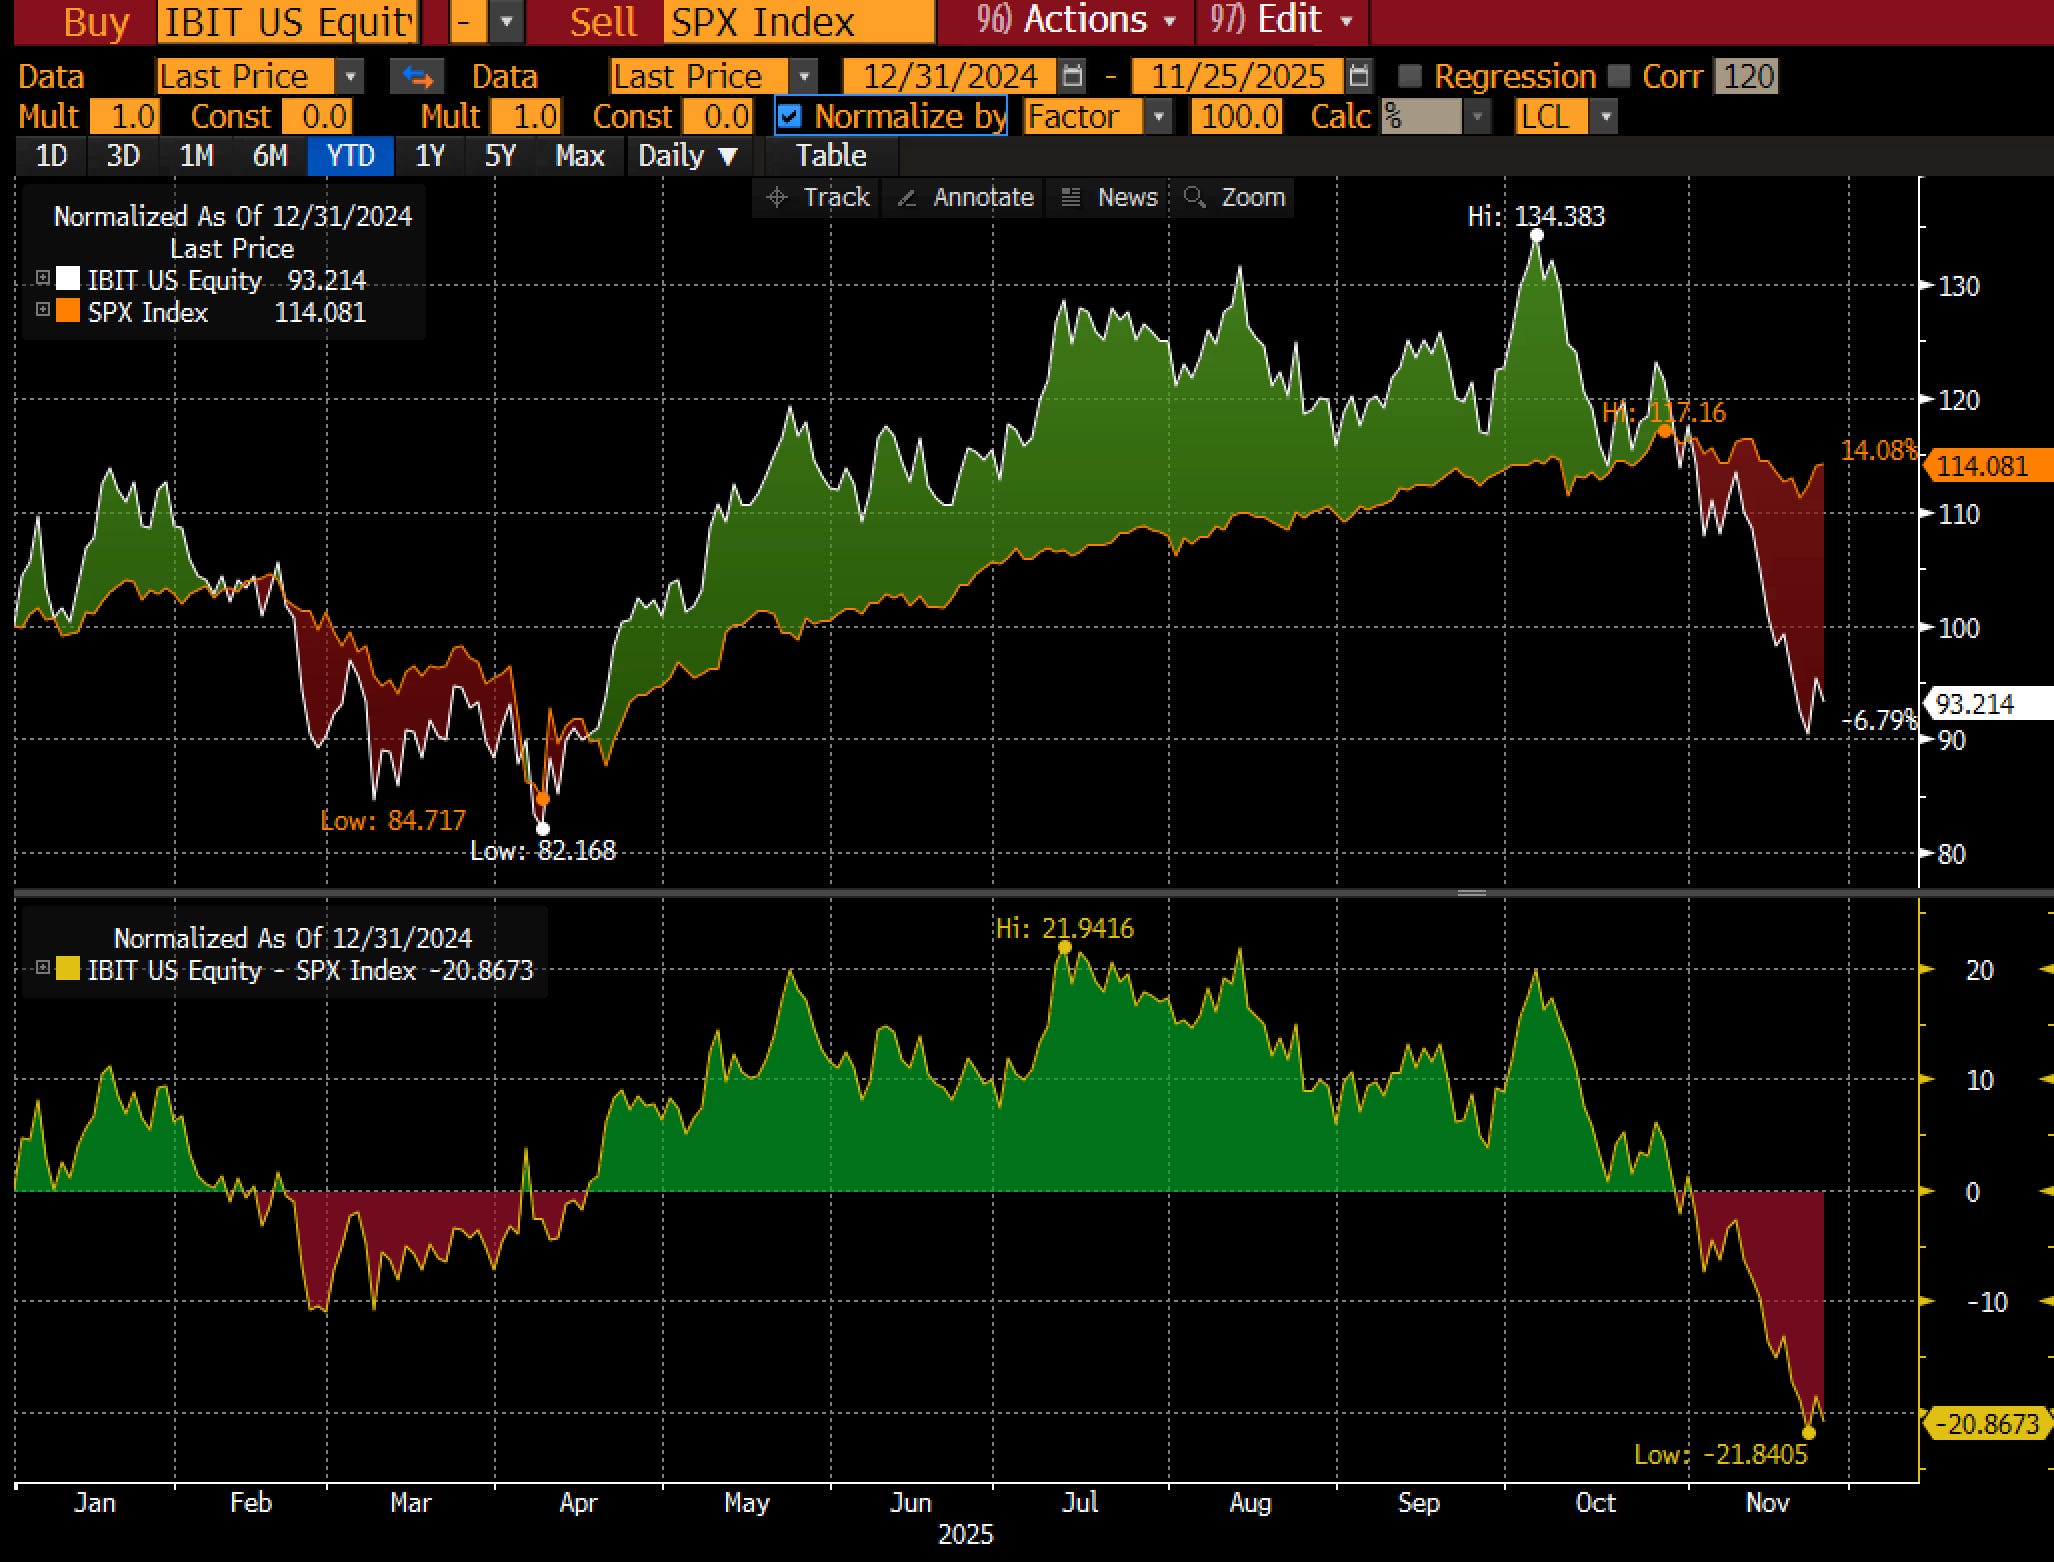
But in scenario 2 (YTD 2025), BTC is down 7%, which is not good. These are investors who came in at Jan 1 2025, and are now underwater. These investors now need 80%+ over the next year, or 50% over the next 2 years to hit their hurdle.
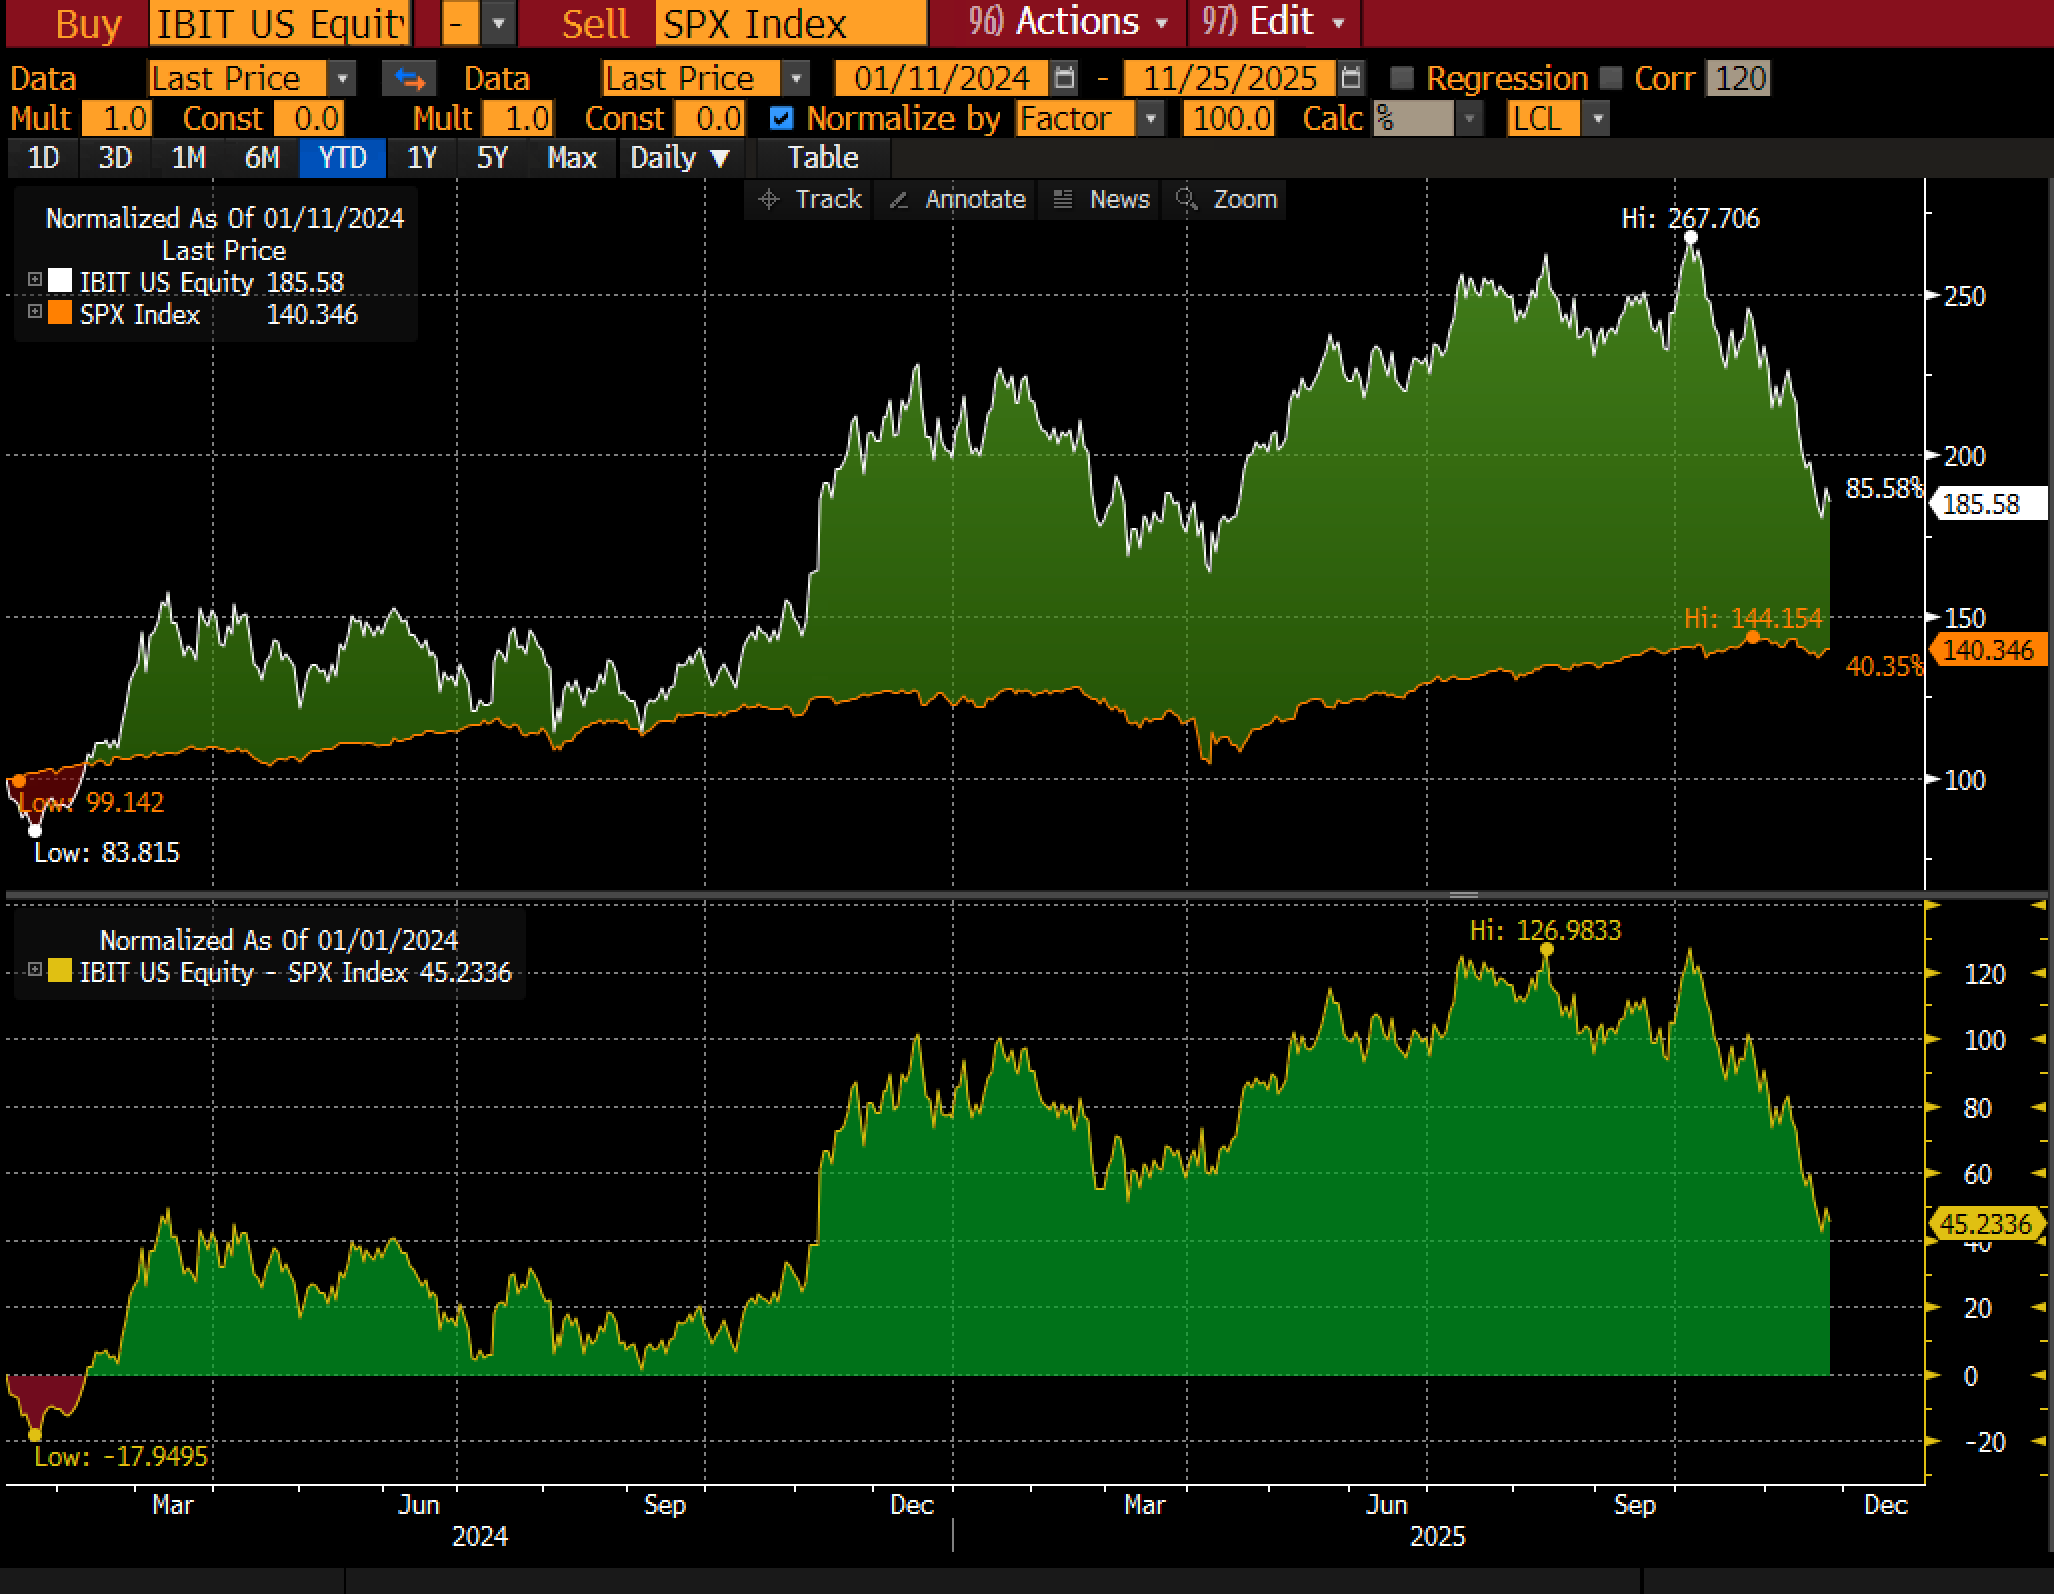
In scenario 3, those who held BTC from inception through now/end of 2025, it is up 85% over ~2 years. These investors are slightly above the 70% return needed to clear 30% CAGR in that timeframe but not as much as when they observed this mark on 12/31/2025, which brings them to an important question: do I sell and lock it now, collect my performance, win, or do I let it run longer?
At that point, the rational investor in the fund management business is going to consider selling. That’s because of the reasons I mentioned above, which is a combination of 1) fee crystallization, 2) protect reputation, and 3) justify “risk management” as a premium service for which the flywheel continues.
So what does this mean?
Bitcoin is now near what is an increasingly important price, 84k, which is the entire cost basis of the inception-to-date-flows into ETFs.
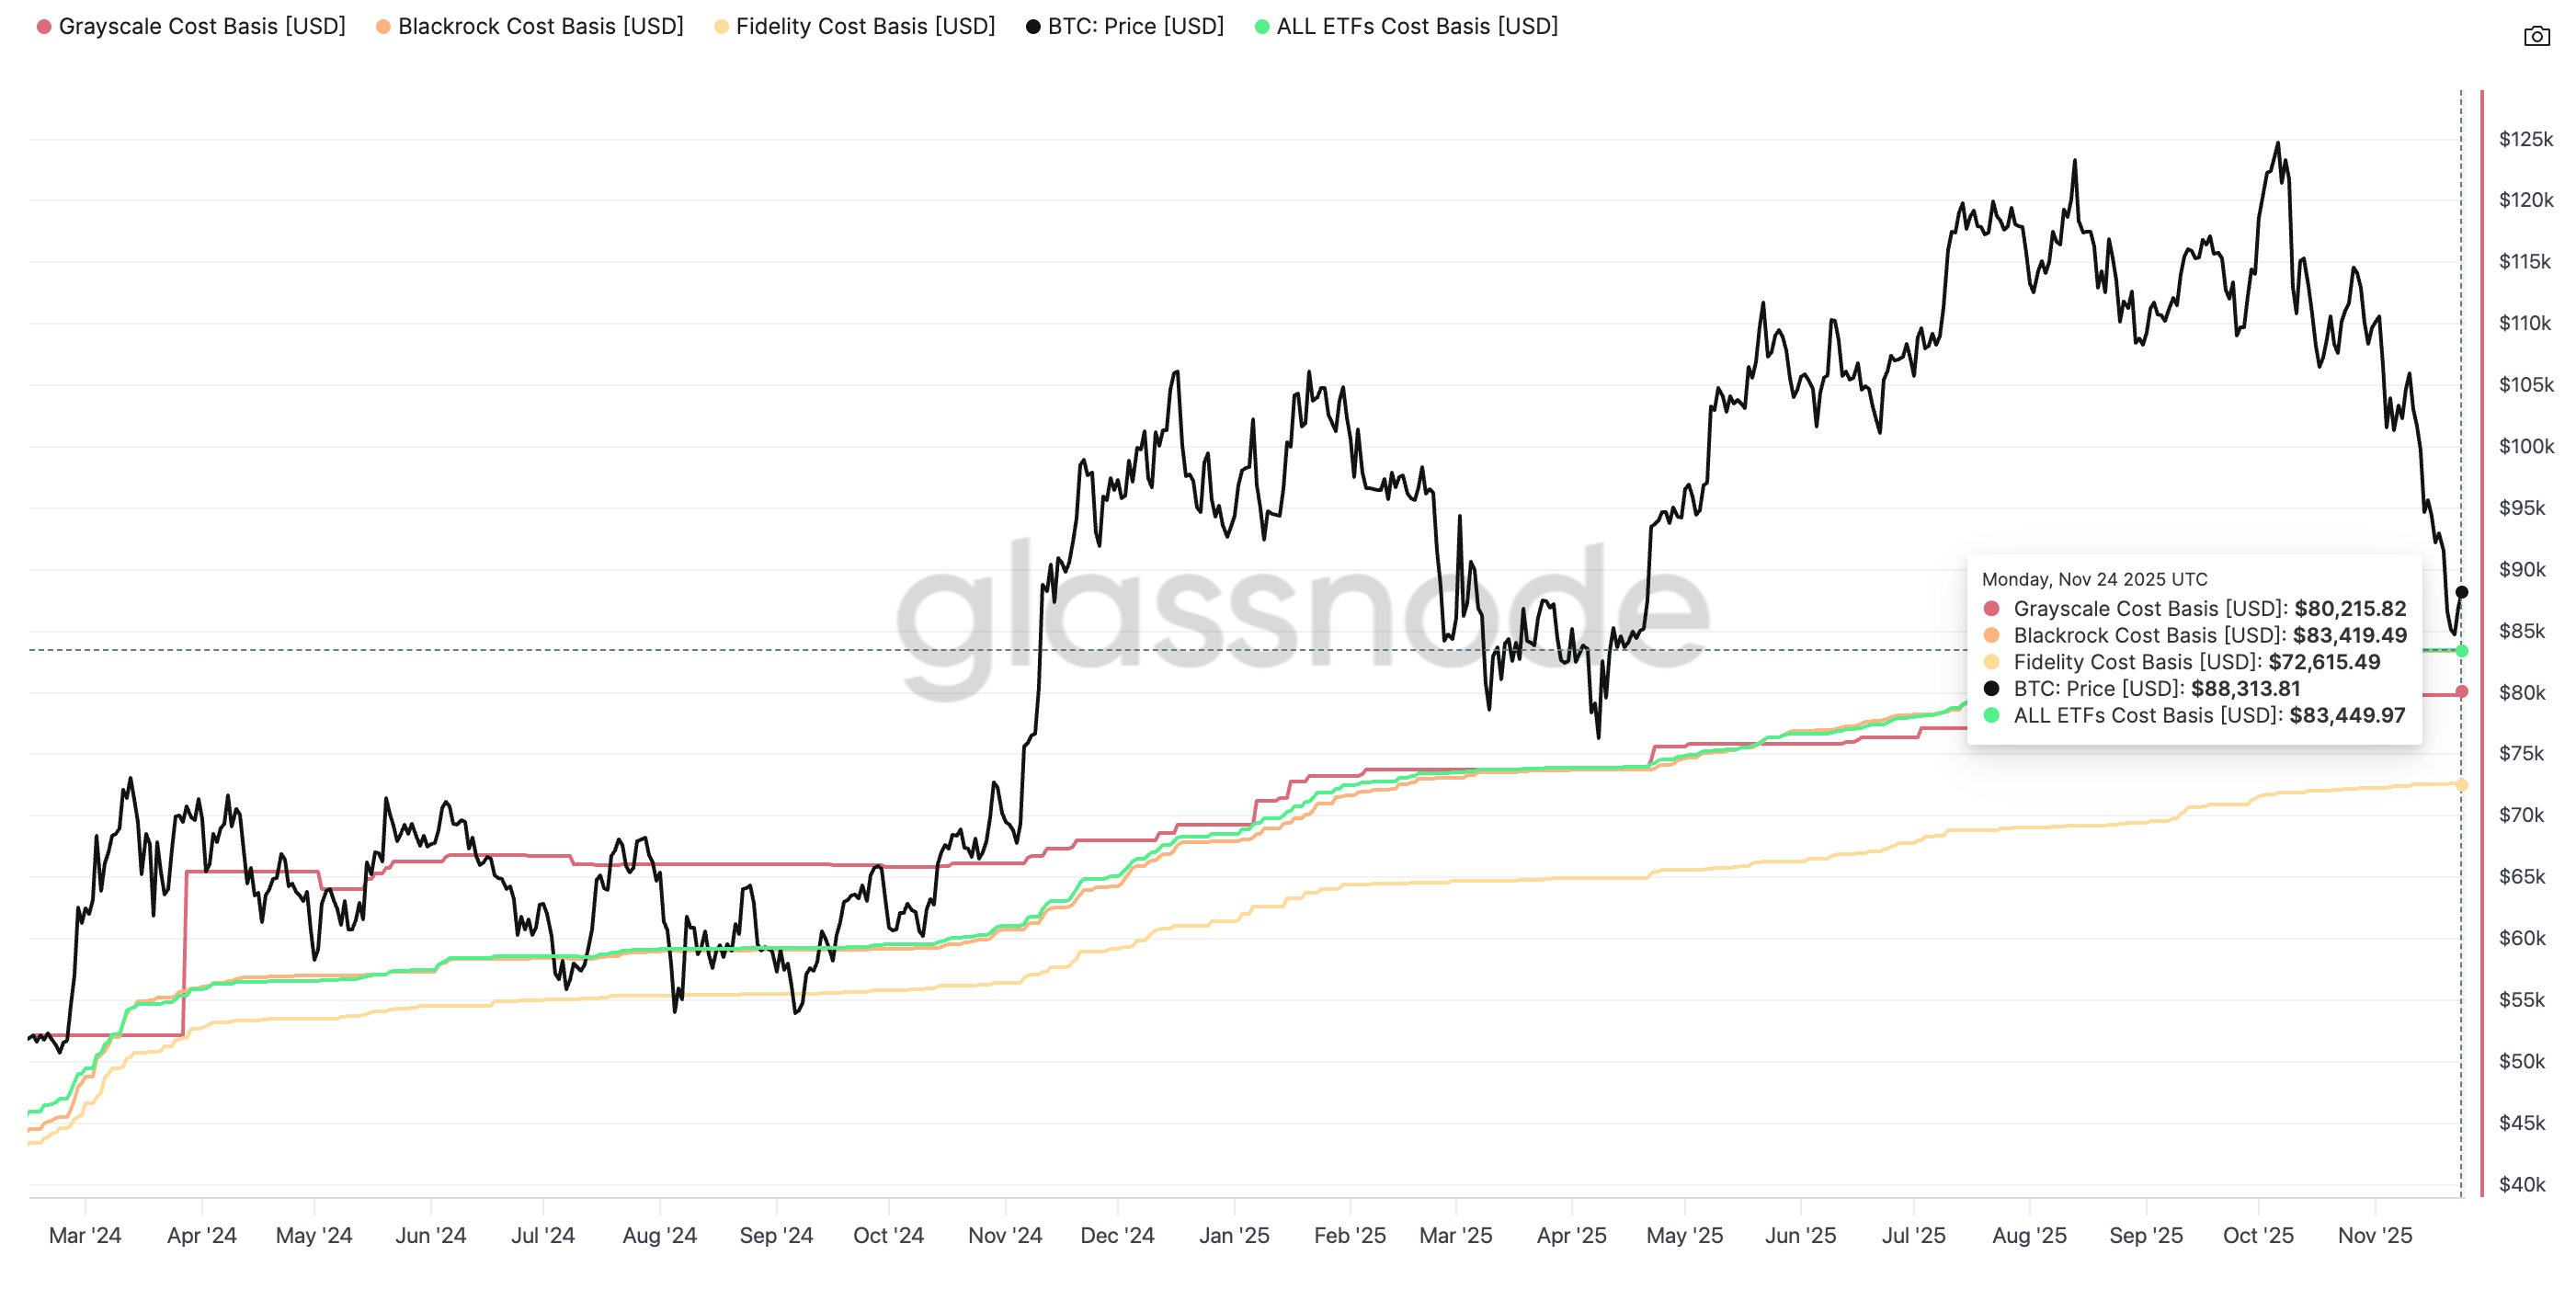
But this picture alone is not complete. Take a look at this from CoinMarketCap, which shows the net flows on a monthly basis since inception.
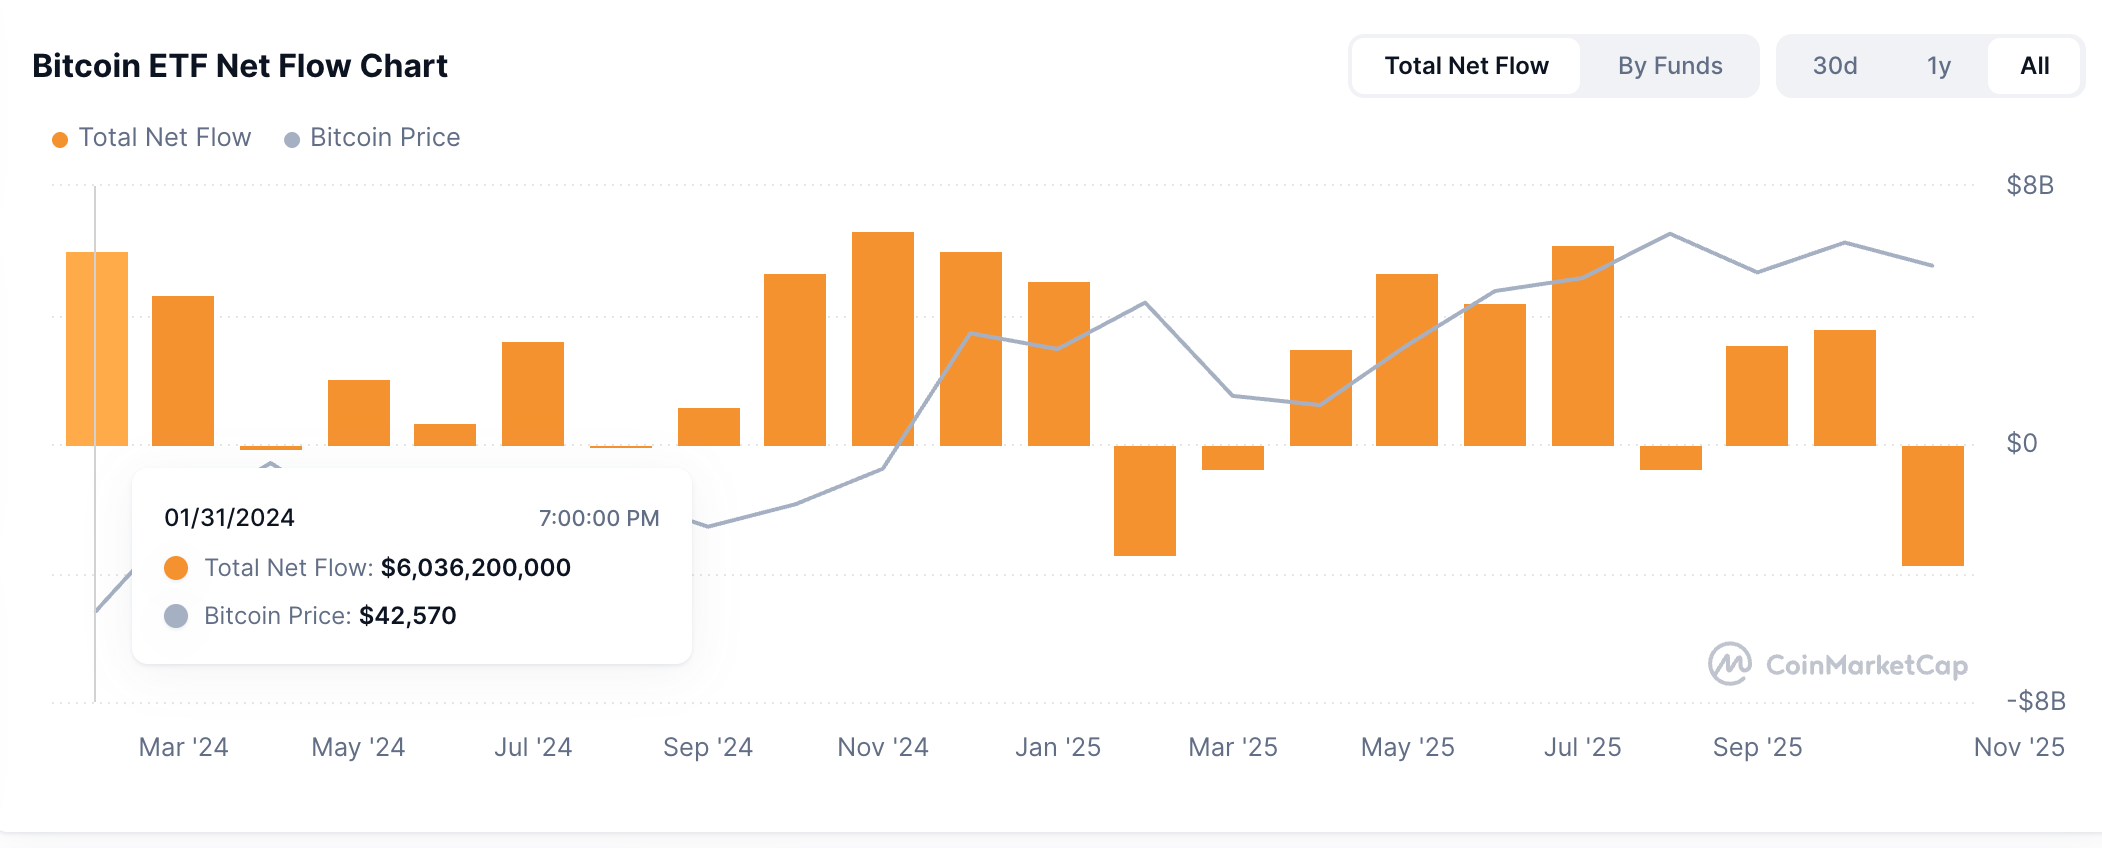
What you can see here is that most of the positive P&L came from 2024, and almost none of the ETF flows in 2025 are in the green (outside of March). Consider for fact that the biggest monthly inflow was October 2024, when BTC was as high as 70k already.
This can be interpreted to be a bearish set up because those most invested in late 2024 who have not made their return hurdle, and are going to realize a decision node over the next year as their two year mark hits, and those who invested in 2025, will require significant outperformance in 2026 to catch up- which may cause them to preemptively exit at a loss, especially if they believe a higher ROI is available elsewhere. In other words, if we enter a bear market, it won’t be because of the four-year cycle but because the two-year cycle never allowed new capital from fund managers to come in at the right entry relative to profit taking of the exiting investors.
In October 2024, the closing price was 70k. In November 2024, the closing price was 96k. This means that as the 1y mark comes up, their hurdle is set at 91k and 125k respectively (I recognize this is too blunt because it doesn’t take into account the intra-month price which needs to be pruned more properly). If you then take as similar approach to June 2025 having been the biggest inflow YTD, the price of 107k translates to $140k being a hurdle by the time we roll into June 2026. You can either make it or break it from there again. By now, you can most likely intuit that the comprehensive analysis is to combine all these flows with a time weighted average.
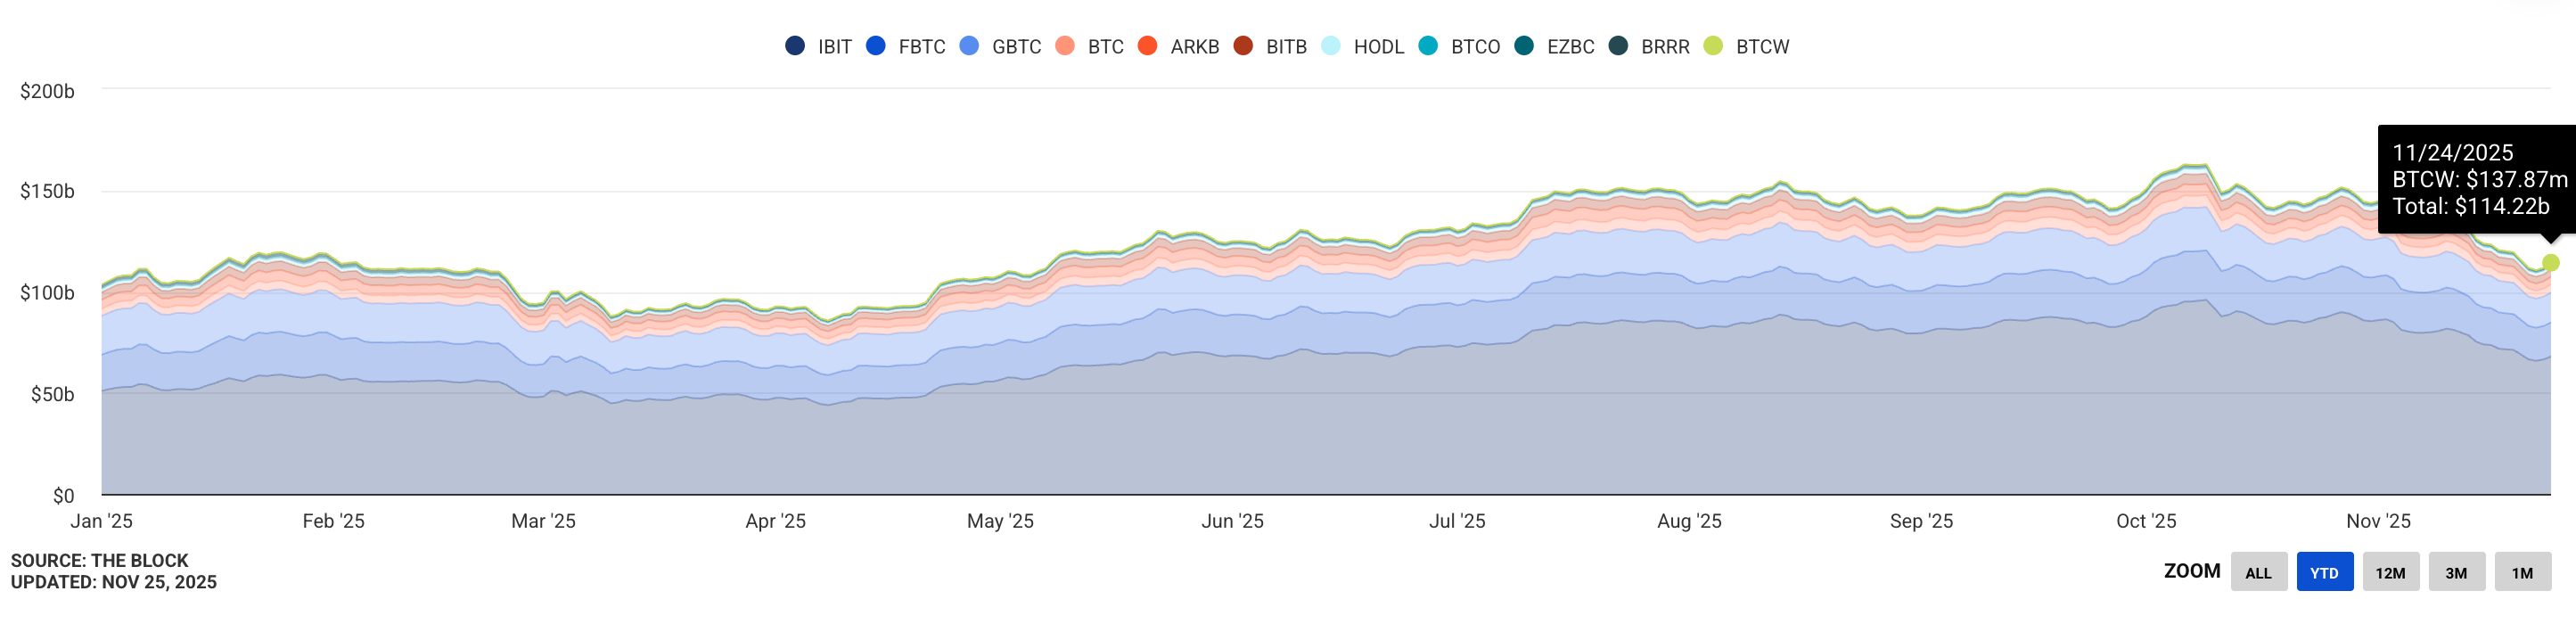
As observable below, we are at an inflection point in which BTC ETF AUM may return back to where we started the year (103.5Bn) if we go down 10% from here.
All this to say - it is increasingly important to not just monitor the average cost basis of the ETF holders, but also the moving average of that P&L by vintage. It is my belief that those will be greatest pressures of liquidity provisioning and circuit breakers for Bitcoin’s price action in the future than the historical 4-year cycles. This will result in a “dynamic 2-year cycle.”
The second most important takeaway here is that if Bitcoin price doesn’t move, but time moves forward (which it will whether you like it or not!), this is ultimately bad for Bitcoin in the institutional era because the ROI is decreasing for the fund manager. Asset management is a “cost of capital” business, and relative opportunities. So if BTC ROI decreases because it is not going up, not going down, but because it’s flat, this is still bad for Bitcoin and will cause investors to sell as their ROI gets compressed below 30%.
In summary, the 4-year cycle is definitely over, but the retirement of old tricks doesn’t mean there aren’t new tricks to be had, and those who can understand this particular behavioral psychology will find a new cycle to work with. It is more difficult because it requires more dynamism in understanding capital flows in the context of cost basis, but in the end, it will reaffirm what is true about Bitcoin - it will always move based on marginal demand vs marginal supply and profit-taking behavior.
It’s just that the buyers have changed, and the supply itself has become less important. The good news is: these buyers are more predictable as agents of other people’s money, and the supply constraint becoming less important means the more predictable thing will be the more dominant thing.
I'd be interested to see your analysis on the BTCTCs impact going forward. Mostly from a HODL perspective. If companies like MSTR and ProCap 😉, are able to continue to accumulate and not sell (at least not next 10 years let's say) they will become an additional or even dominant 🤷 supply metric.
Thanks Jeff. Good insight into the asset management industry incentive structure.
I’m now curious if there is any way to model the “supply variable“ of the OG selling dynamic? This seems to be more important than the block rewards supply.